27-Inch 1440p Showdown: WootVision Pro 27Q M240 vs 27QF I210 vs Gigabyte G27Q20
We lab-test three 27-inch 1440p high-refresh monitors—the Mini-LED WootVision Pro 27Q M240, the entry-level WootVision 27QF I210 and the Gigabyte G27Q20—under one motion, colour and brightness standard.
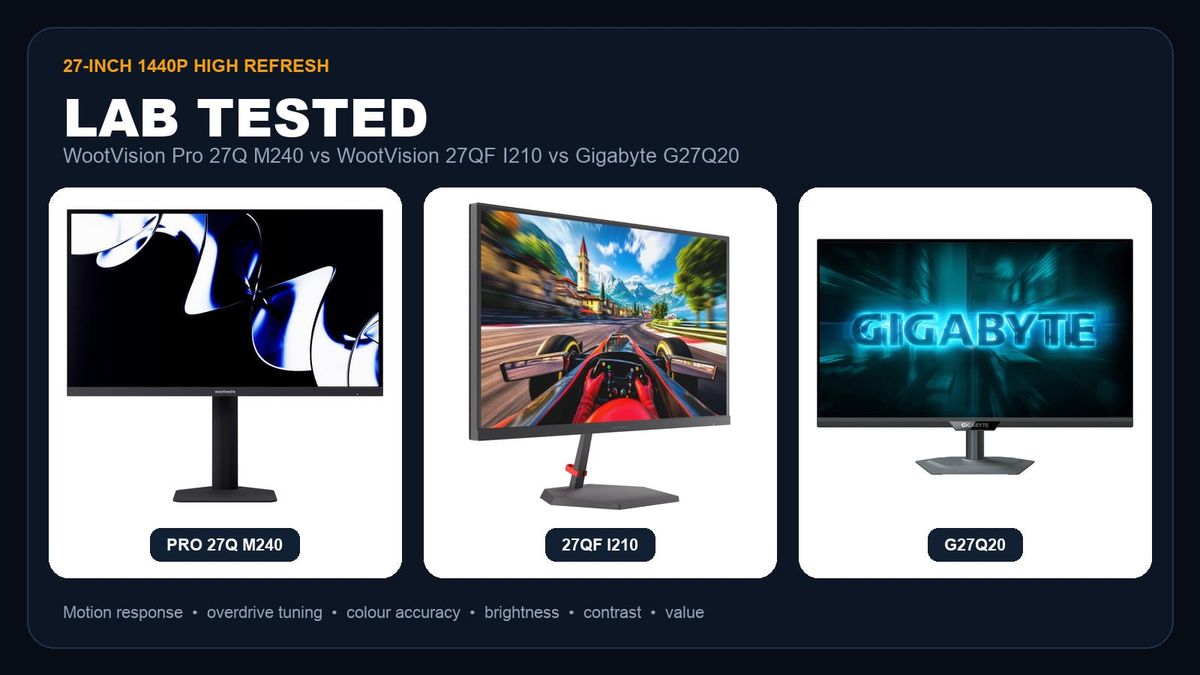
Three 27-inch, 2560×1440 monitors that all promise “1ms” and 200Hz-plus refresh rates, priced between R2,999 and R4,599. One is a Mini-LED HDR1000 panel, one is our new entry-level fast IPS, and one is Gigabyte’s popular SuperSpeed IPS. Under the same motion, colour and luminance testing standard, the differences are much clearer than the spec sheets suggest.
We compared the WootVision Pro 27Q M240, the WootVision 27QF I210 and the Gigabyte G27Q20. As with our 34-inch ultrawide comparison, this article focuses on what the pixels actually did: response time and overdrive behaviour, calibrated colour accuracy, contrast, brightness range and the practical value of each monitor.
Price and specification snapshot
Prices below include VAT and already reflect our displayed discount, rechecked on 9 September 2026. The Gigabyte G27Q20 is in stock; both WootVision models are on pre-order with stock expected on 25 September 2026.
| WootVision Pro 27Q M240 | WootVision 27QF I210 | Gigabyte G27Q20 | |
|---|---|---|---|
| Price | R4,599 (was R5,899) | R2,999 (was R4,399) | R3,999 (was R4,999) |
| Availability (9 Sep 2026) | Pre-order, ETA 25 September | Pre-order, ETA 25 September | In stock, ships in 1–2 business days |
| Panel | 27in Fast IPS, Mini-LED (1152 zones) | 27in IPS | 27in SuperSpeed IPS |
| Resolution / refresh | 2560x1440 at 240Hz | 2560x1440 at 210Hz (OC), 200Hz typical | 2560x1440 at 210Hz (OC), 200Hz native |
| Published brightness | 500cd/m2 SDR, 1000cd/m2 HDR peak | 350cd/m2 | 350cd/m2 |
| Published contrast | 1,300:1 | 1,000:1 | 1,000:1 |
| Published gamut | 98% DCI-P3 | 96.8% DCI-P3 / 99.97% sRGB | 94% DCI-P3 / 123% sRGB |
| HDR | HDR1000 (Mini-LED local dimming) | HDR10 | HDR10 |
| Adaptive sync | Adaptive Sync | Adaptive Sync | FreeSync Premium, G-Sync Compatible |
| Video inputs | 2x HDMI 2.1 (TMDS), 2x DP 1.4 | 2x HDMI 2.1 (TMDS), 2x DP 1.4 | 2x HDMI 2.0, 1x DP 1.4 |
| USB | None | None | 1x USB 2.0 (firmware updates only) |
| Stand | Height, pivot, tilt | Tilt only | 130mm height, tilt, swivel, pivot |
| Warranty | 3 years | 2 years | 3 years |

How we tested
For motion testing, each monitor ran at its native 2560×1440 resolution and maximum refresh rate—240Hz for the M240, 210Hz (overclocked) for the I210 and the Gigabyte. We applied the same transition sequence and the same response threshold to every display, then swept through every overdrive setting, recording initial and perceived response time, overshoot error, refresh-window compliance and an overall visual-response rating.
For colour, each monitor was calibrated to a 120cd/m² target and then verified against the same standardised colour-patch sequence. We report colour error, white point, gamma, black level and contrast. The figures below are post-calibration verification results, not claims about untouched factory accuracy. Brightness range was measured separately at the panel centre with the OSD at 0% and 100%, no profile applied.
Pixel response: finding the best overdrive setting for each monitor
Every monitor here offers several overdrive settings, and the right one makes a real difference to motion clarity. So rather than quote a spec-sheet number, we tested every overdrive mode on all three monitors under the same threshold and picked the setting that delivers the fastest perceived response with the least overshoot. Those are the settings we recommend below, and they are the ones we would use ourselves.
WootVision Pro 27Q M240: Best is the sweet spot
At the Best overdrive setting, the M240 produced a 5.35ms average perceived response and a 4.93ms initial response, with an 89.17/100 visual-response rating—the strongest result in this comparison. Average overshoot was 3.33 RGB with a worst error of 26, and 40% of transitions completed inside the 4.17ms frame window. Normal is a slightly slower (5.72ms perceived) but cleaner alternative, with only 1.4 RGB average error and half of all transitions inside one frame.
Extreme is the trap. Its initial response fell to 3.29ms, but average overshoot jumped to 45.7 RGB, 60% of transitions showed heavy overshoot and the perceived response worsened to 8.94ms—slower than running with overdrive off. Avoid it.
WootVision 27QF I210: Best or Normal, never Extreme
The I210’s best result was also its Best setting: 6.52ms perceived, 5.02ms initial, 86.56 visual rating, 5.6 RGB average error and a 19 RGB worst case. Normal is nearly as quick (6.78ms) with slightly less average overshoot but a higher worst case. Both are usable everyday settings; neither reaches the M240’s speed, which is expected from a lower-cost panel class.
Extreme is unusable: 59.3 RGB average overshoot, a worst error of 176 RGB and a 12.4ms perceived response. If you see bright coronas behind moving objects, check the overdrive setting first—Extreme was unusable in our testing.
Gigabyte G27Q20: Balance is the setting to use
Gigabyte’s Balance mode is the clear choice: 6.05ms perceived, 4.80ms initial, an 87.07 rating and 40% of transitions inside the 4.76ms frame window. Average overshoot (5.17 RGB) is a little higher than the M240’s, with a 33 RGB worst case. Picture Quality is the cleanest overdrive mode of any monitor here (0.47 RGB average error) at the cost of a 6.77ms perceived response.
Speed and Smart OD both hit a ~3.1ms initial response—still well above the 0.5ms label, which uses a different measurement method—but both averaged 33.9 RGB of overshoot with a 138 RGB worst case, and their perceived response ballooned to over 9ms. In our testing, Smart OD behaved almost identically to Speed rather than adapting.

| Tested mode | Perceived RT | Initial RT | Average overshoot | Worst overshoot | Visual rating | Within one frame |
|---|---|---|---|---|---|---|
| Pro 27Q M240 — Best (240Hz) | 5.35ms | 4.93ms | 3.33 RGB | 26 RGB | 89.17 | 40% of 4.17ms |
| Gigabyte G27Q20 — Balance (210Hz) | 6.05ms | 4.80ms | 5.17 RGB | 33 RGB | 87.07 | 40% of 4.76ms |
| WootVision 27QF I210 — Best (210Hz) | 6.52ms | 5.02ms | 5.60 RGB | 19 RGB | 86.56 | 26.67% of 4.76ms |

Colour reproduction and calibration
The I210 was the standout here: after calibration it verified at an average ΔE00 of 0.22 and a maximum of 1.00, with a 6521K white point and gamma 2.20—comfortably inside our recommended tolerance on every patch. The Pro 27Q M240 met our recommended average (0.77) and maximum (2.57, a saturated red patch) ΔE00 tolerances at gamma 2.19. Its calibrated white point measured 6516K but sat 3.39 ΔE00 from the target—a slight green tint that our profile did not fully remove and the largest white-point error in this group.
The Gigabyte was the weakest of the three: average ΔE00 1.66 and a maximum of 5.42 on pure red, with a 6588K white point that remained 2.36 ΔE00 from its report’s assumed target after calibration (the Gigabyte report assumed a 6600K daylight target; the two WootVision reports assumed 6500K). It is fine for gaming and general use, but we would not choose it for colour-critical work without a hardware calibrator and colour-managed software.
Two M240 notes. First, its factory Normal colour temperature preset measured a cool 8405K out of the box (average ΔE00 3.17); we built a second profile against the Warm preset, and the sRGB picture mode measured 7193K before calibration. Second, with local dimming disabled for this SDR test its contrast was the lowest here at 794:1—local dimming is designed to raise effective contrast in HDR and dark-room use, which is the point of the 1152-zone backlight, but we did not measure that behaviour for this article.

| Measured colour metric | Pro 27Q M240 | 27QF I210 | Gigabyte G27Q20 |
|---|---|---|---|
| Average ΔE00 | 0.77 | 0.22 | 1.66 |
| Maximum ΔE00 | 2.57 | 1.00 | 5.42 |
| Measured white point | 6516K | 6521K | 6588K |
| White-point error vs assumed target (ΔE00) | 3.39 | 0.81 | 2.36 |
| Measured gamma | 2.19 | 2.20 | 2.19 |
| Luminance during verification | 120.7cd/m² | 113.5cd/m² | 120.1cd/m² |
| Black luminance | 0.1522cd/m² | 0.1258cd/m² | 0.1018cd/m² |
| Measured contrast (SDR) | 794:1 (local dimming off) | 902:1 | 1,180:1 |
Brightness, black level and HDR
The M240 reached 565cd/m² at 100% OSD in SDR with local dimming off—already above its 500cd/m² SDR rating and far beyond the 346cd/m² and 349cd/m² of the I210 and the Gigabyte, which both land right on their 350cd/m² specifications. Its 1000cd/m² HDR peak claim was not measured for this article.
Minimum brightness matters for late-night use: the I210 dims to 32cd/m², the M240 to 48cd/m² and the Gigabyte to 62cd/m².
On HDR, be realistic. The I210 and G27Q20 both accept HDR10 signals, but as ~350cd/m² IPS panels without local dimming and with roughly 1,000:1 measured contrast they cannot deliver meaningful HDR highlights or deep blacks; treat HDR as a compatibility feature. The M240 is different in kind: 1152 local-dimming zones and a measured 565cd/m² SDR peak mean it can produce genuinely bright highlights against dark backgrounds. As with all Mini-LED displays, expect some blooming around small bright objects and some dimming of bright UI elements in dark scenes—several owners mention exactly that in their reviews on the product page.

Connectivity, ergonomics and warranty
Pro 27Q M240 advantages
- Fastest measured motion in the group and the only 240Hz panel.
- Mini-LED backlight with 1152 zones and a 565cd/m² measured SDR peak—the only one here built for real HDR; HDR performance was not measured for this article.
- Two HDMI 2.1 (TMDS) and two DisplayPort 1.4 inputs; height, pivot and tilt adjustment; three-year warranty.
27QF I210 advantages
- Lowest price at R2,999—R1,000 under the Gigabyte and R1,600 under the M240.
- Best calibrated colour accuracy of the three, with a 96.8% DCI-P3 published gamut.
- Same four-input layout as the M240 (2× HDMI 2.1 TMDS, 2× DP 1.4), with PIP/PBP listed; the trade-offs are a tilt-only stand and a two-year warranty.
Gigabyte G27Q20 advantages
- In stock now; the WootVision pair are on pre-order until late September.
- The most adjustable stand here (130mm height, tilt, swivel and pivot), a three-year warranty and the highest measured SDR contrast.
- FreeSync Premium and G-Sync Compatible certification. Note it uses HDMI 2.0 rather than 2.1 and has a single DisplayPort.
Which one should you buy?
Best overall: WootVision Pro 27Q M240
Fastest motion, the only Mini-LED HDR panel, the brightest by a wide margin, accurate after calibration (with a slight white-point tint) and a three-year warranty. At R4,599 it is R600 more than the Gigabyte and worth it if you can wait for stock.
Best value: WootVision 27QF I210
At R2,999 it delivers 210Hz, excellent calibrated colour and the same video inputs as the M240. Motion is a step behind, and the tilt-only stand is the compromise; add a VESA arm and it disappears.
Best if you need it today: Gigabyte G27Q20
Clean motion in Balance mode, the highest SDR contrast, the best stand and a three-year warranty, in stock now at R3,999. Calibrate it if colour accuracy matters to you.
If you play fast shooters at high frame rates and want HDR that actually does something, the M240 is the clear choice and the extra R1,600 over the I210 buys measurable speed and a different class of backlight. If you mainly want a sharp, fast 1440p screen for mixed gaming and work on a budget, the I210 is hard to argue with. The Gigabyte earns its place on availability, ergonomics and warranty rather than on measured picture quality.
Testing limitations
- Results describe the tested units and firmware; panel-level performance can vary from unit to unit.
- All motion results use the same response threshold and transition protocol. Results produced under other standards should not be mixed into these tables.
- Colour figures are post-calibration verification results. M240 SDR contrast was measured with local dimming off; its HDR peak brightness and local-dimming behaviour were not measured.
- We did not perform input-latency, VRR-flicker or backlight-uniformity sweeps for this article.
- Live stock and pricing can change after publication.
Sources
- Wootware in-house motion, colour, luminance and contrast reports for the tested WootVision Pro 27Q M240, WootVision 27QF I210 and Gigabyte G27Q20.
- WootVision Pro 27Q M240 at Wootware.
- WootVision 27QF I210 at Wootware.
- Gigabyte G27Q20 at Wootware.
- Gigabyte official G27Q20 specifications.
Test values were transcribed from the original Wootware laboratory reports. Product specifications, prices and stock status were rechecked against the live product pages on 9 September 2026.